In order to determine mitigation strategies for Iowa, Gov. Kim Reynolds is relying on a set of metrics developed by State Public Health Medical Director and Epidemiologist Dr. Caitlin Pedati and the IDPH. While the Governor continually refers to this as a data-driven process, there are catastrophic events that could occur under their current metric system and still not trigger a shelter-in-place order.
Starting Line dug into the numbers for one of the hardest-hit regions of the state to see what additional factors it would take to necessitate a stay-at-home directive from Reynolds.
The background:
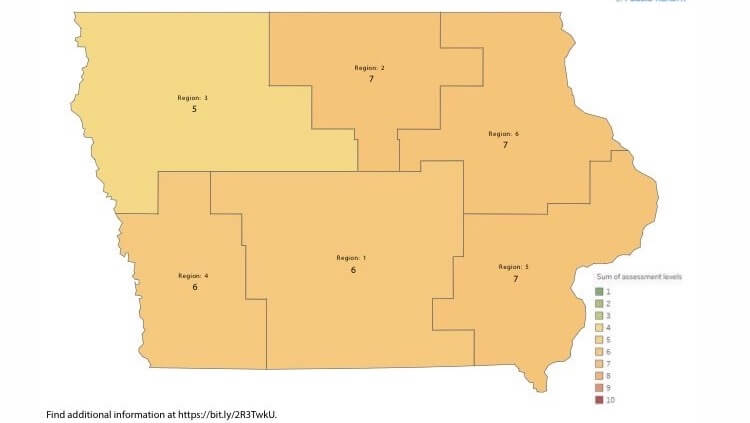
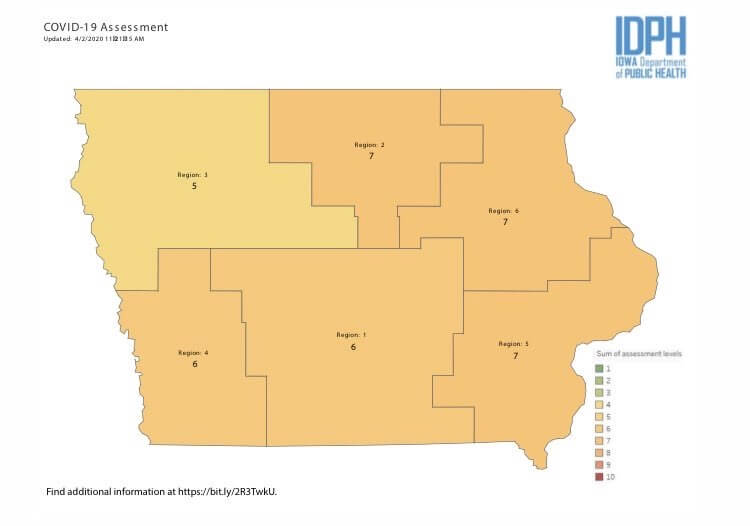
This process breaks the state into six different regions, (seen below) and assigns them a numerical score based on four factors, that are each rated from zero to three.
The factors that go into this analysis are:
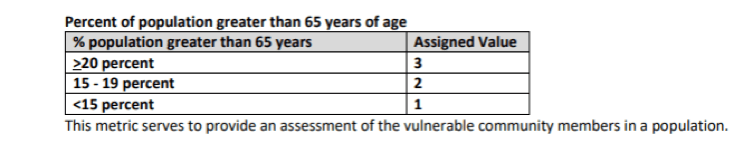
- Percent of population greater than 65 years of age
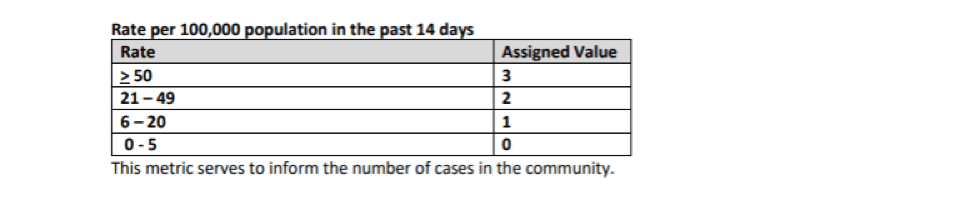
- Rate of positive cases per 100,000 population in the past 14 days
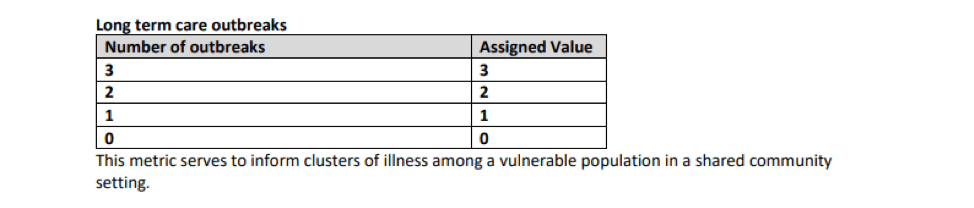
- Long term care outbreaks
- Percent of identified cases requiring hospitalization
This leads to a maximum of 12 points that each region could have. The governor recommends the following responses for a region when it achieves a certain value.

Sum of Assigned Values
0-3 Preparation and Awareness
4-9 Social Distancing and Mitigation Strategies
≥10 Shelter in Place
Starting Line looked at the numbers in Region 5, the southeastern portion of Iowa that includes Johnson and Scott counties. By the map provided, this region is already to seven points in the metrics. There is only limited information provided by the state, but using the map provided, statistics from the Governor’s press conferences, and statistics from the U.S. Census bureau, we were able to break down the numbers for this region and come up with the following table:
| Metric Name | Metric Score | Points Given |
| Percent of Population over 65 | 16.87 | 2 |
| Rate per 100,000 population in the last 14 days | 34.2 | 2 |
| Long term care outbreaks | 0 | 0 |
| Percent of identified cases requiring hospitalization | Greater than 15% | 3 |
| TOTAL | — | 7 |
Percent of population greater than 65 years of age – Score of 2
According to the U.S. Census Bureau, for the counties in Region 5, 16.87% of the population is older than 65. This number is static and cannot change based on the spread of the virus. Using the table below that is in a report from the Iowa Department of Public Health, this percentage leads to an assigned value of 2.
Rate per 100,000 cases in the last 14 days – Score of 2
This is perhaps the most significant metric, because it tracks how fast the virus is moving through the population. Based on publicly reported numbers, this region has had 263 cases overall, but if you narrow it down to the past 14 days, it looks to be 227 (Johnson County had a large number of cases at the outset). The total population for the region is 663,558, so this comes out to about 34.2 cases per 100,000 people. This would earn the score of 2 because it falls between 21 and 49 cases.
Long Term Care Outbreaks – Score of 0
Based on statements from Governor Reynolds, there have been no outbreaks in this region at long term care facilities. The only reported outbreak has been at a nursing home in Cedar Rapids.
Percent of identified cases requiring hospitalization – Assumed score of 3
This is the only metric that we do not know because the governor has not released the percentage of cases requiring hospitalization by county. However, using the fact the other metrics add up to 4, and that we know this region has a total score of 7, this category must have a score of 3. This means that the percent of identified cases requiring hospitalization for this region is over 15%.
Oddly enough, this is a metric that could actually decrease with more widespread testing, which many see as a method to find and quarantine more people carrying the virus to slow its spread. If you tested more people who are asymptomatic, the hospitalization percentage would drop. Right now, Iowa’s stringent requirements for administering a test means that it’s mostly going to those in the worst conditions, and those suffering mild symptoms are simply told to stay at home.
There could be a situation where more testing boosts the number of cases per 100,000 population with the virus that at the same time lowers the hospitalization metric. That hospitalization number could drop and make it harder to shelter in place without it actually meaning that things are getting better.
This again leads us to the table that was presented above.
| Metric Name | Metric Score | Points Given |
| Percent of Population over 65 | 16.87 | 2 |
| Rate per 100,000 population in the last 14 days | 34.2 | 2 |
| Long term care outbreaks | 0 | 0 |
| Percent of identified cases requiring hospitalization | Greater than 15% | 3 |
| TOTAL | — | 7 |
What has to happen to get to a shelter in place
For this region to reach a score of 10 and trigger a shelter-in-place recommendation, it would need an additional 3 points. Since the percent of population over 65 is stagnant, and the percentage of hospitalization is already maxed out, there are only two scenarios that would trigger that outcome. Those situations are either three outbreaks at a long term care facility, or two outbreaks at long term care facilities and a decent jump in the rate of infection per 100,000 people. But again, the hospitalization metric could go down with more testing, even though that new number wouldn’t necessarily mean things are getting any better.
While one of these situations could happen, the virus could continue to spread in dangerous ways without reaching that benchmark. Imagine a scenario where the virus is rapidly spreading through communities, but long term care facilities in the area have managed to avoid being affected. No matter how fast the virus is spreading, or how many people die, there would be no way in that case that the data could trigger a shelter-in-place order based on the Governor’s determination.
by Adam Henderson
Posted 4/5/20
10 Comments on "How Bad It Needs To Get To Trigger An Iowa Shelter-In-Place Order"
This is a great breakdown and explanation, Adam. Thank you. I still do not agree with Gov. Reynolds’s response to this situation thus far; regardless, this article is excellent. Stay well, ISL staff!
How about the governor check the number of sick and dead, then decide to take action designed to prevent any more sick and dead. She doesn’t seem to see how sociopathic and gruesome it looks to deem a certain number of deaths in the population as too statistically insignificant for intervention.
How do does the governor know that the metric is the correct way to determine a shelter in place order? Has it been tested successfully before? Are other states using it? Seems like IDPH just made this up and doesn’t know if it will really work. Had anyone asked about this?
I want to trust our govvernment, but since our president knew in January and didn’t do anything until there was the coronavirus was starting to hit our country. I hate to see a lot more people die if we don’t have the order to close and stay at home policy now. It is in my State of Iowa and Lee County in Iowa am concerned for my city o Fort Madison, IA. I am staying home and so are my sisters and my son. He is still working in the wind tower industry in Lee County. Siemens is the companys name and they are taking temps of workers before they can go into work. They are spaceing their employees when they take their breaks which is good. But I am concerned when the coronavirus hits us more then it has right now, about their safety as other places that are still working.
While the data she apparently is using is all well and good (Iowa is not other states, and needs somestate-specific data), her model doesn’t “learn” from other states’ experiences. We already know that many states are still behind (some, apparently , by several weeks) others – and the “virus curve” is moving westward and Soutwest-ward into the heartland. If she rreally wants to “flatten the curve, she needs to take into account what other states have already gone through and implement mitigations based on more than just her (somewhat specious) current data points. Re-inventing the wheel is kind of shortsighted.
I have no problem with the metrics and I believe Governor Reynolds is doing quite a good job.
The metrics are the metrics, and she has agreed to trigger a shelter in place order based on these metrics. But, nobody should assume that these are the only conditions by which the Governor would issue such an order. The Governor is not a robot. She has made good decisions up to this point, and there is no reason to believe that will change going forward.
I think the Governor has done a great job in balancing the issues to both protect lives and livelihoods.
Every state is different, so we do not need to act like every state, but, we should escalate as is prudent.
The city of New York is packed like sardines. It would have been prudent to have lock that city down back in February (not that people would have listened back then). But, it would not have made sense to do that in Des Moines or Cedar Rapids, then or now.
Actions have been taken. People by-in-large have been keeping their distance. Most people are staying at home, yet, we can still go out to get things we need when we have to. And, we seem to be taking care of each other.
Iowa is a great state to be in, in good times and in bad. We will weather this storm like we always do, together.
If there is good science and research behind the regional metrics system chosen by the governor, why haven’t the science and research been made public? The DES MOINES REGISTER is trying to get that information via an open records request, but given the governor’s past record, I’m doubtful that the request will be granted.
And if the governor has been keeping on top of this pandemic in Iowa, why were bowling alleys and pool halls, obviously NOT essential businesses, allowed to remain open until just a few days ago? And there are reports of other very-non-essential businesses still operating.
I’ve read a few detailed critiques of the governor’s regional numbers system in the past few weeks, and they seem to make more sense than the limited explanations we’ve been given, which pretty much amount to “trust me and my staff, we know what we’re doing.” As for most Iowans being responsible, it doesn’t take many outliers to cause serious problems. Anyone interested can read the new op-ed piece in the CEDAR RAPIDS GAZETTE about what it’s like to work in a fast-food place in northwest Iowa and see irresponsible social behavior day after day.
The health of our state would benefit in establishing a shelter-in, free testing for every resident of Iowa for the Coronavirus so we have a real numbers for who is infected before plans can be made to re-open the functions of our state. Many who are walking around and interacting with others possess the virus but have not displayed symptoms. These citizens are spreading to their communities and as weather warms will have more opportunities to gather together. Yes the stress of failed economics due to the shut downs affects mental health, but the spread of the virus and increased outbreaks will be a greater risk. Test everyone.
April 16, 2020: Region 6 was scored a 10 today. No SIP order was given. Only change was that you can’t gather with people outside of your family. More pleas from Gov. to do the responsible thing and stay home… heard a lot of “as we’ve been saying all along…”
So we’re going to continue to do the same thing but beg harder? Yeah, that will change things..